

DMO marketing ROI compares incremental value attributable to marketing with the full cost of producing it. A credible calculation connects investment to qualified travel demand, partner action, visitation, visitor spending, public value and, where the data permits, incremental lift.
The strongest report does not force every outcome into one inflated number. It shows what was observed, what was attributed, what was modeled, what remains uncertain and which budget decision should follow.
Start with a travel campaign people can inspect
Percepture’s Amazon and Phantom Ranch work gives destination leaders a concrete example of travel storytelling, earned attention and cross-channel execution. The measurement lesson is equally important: awards, reach and visibility are evidence, but they are not automatically DMO marketing ROI.


The video and case study provide campaign context. They do not replace a destination-specific incrementality study or guarantee the same outcome for another organization.
Verify the team before trusting the dashboard
Destination measurement crosses strategy, media, content, search, public relations, partner systems and analytics. These signals help boards and executives evaluate the experience behind the methodology.





How should a DMO measure marketing ROI?
For DMO marketing ROI, start with the decision, calculate the full investment, measure qualified demand and partner action, connect those signals to visitation and spending, estimate public value, test incremental lift where feasible, and label every result by source, attribution method and confidence.
The executive view
Measure an evidence chain
A DMO marketing ROI evidence chain moves from cost and delivery to demand, partner action, destination outcomes, public value and allocation.
Separate unlike numbers
Marketing ROI, media ROAS and tourism economic impact answer different questions. Do not present them as substitutes.
Label confidence
State whether a result is observed, platform-attributed, partner-reported, survey-estimated, modeled, directional or incremental.
End with a decision
Every KPI should help leaders scale, optimize, reallocate or stop an activity. A result without a threshold is reporting, not management.
Who this measurement guide is for
DMO and CVB executives
Use DMO marketing ROI to defend the budget, set evidence standards and decide where the next dollar should go.
Boards and public officials
Read DMO marketing ROI results in terms of what changed, how marketing may have contributed and how certain the evidence is.
Finance and research teams
Keep DMO marketing ROI consistent by aligning cost definitions, data sources, reporting windows and value calculations.
Destination partners
See whether useful demand moved toward hotels, venues, attractions, restaurants and events.
DMO marketing ROI, ROAS and economic impact are different
A DMO marketing ROI comparison must keep these related measures separate. The table below prevents a board report from treating a media metric as a destination-wide financial result.
| Measure | Calculation or definition | Best use | Main caution |
|---|---|---|---|
| Marketing ROI | (Incremental value attributable to marketing − total marketing cost) ÷ total marketing cost × 100 | Evaluating the return produced by a fully loaded marketing investment | Value must be defined, and causality requires credible incremental evidence. |
| Media ROAS | Attributed revenue ÷ media spend | Comparing paid campaigns with observable transactions | It excludes agency, creative, research, staff, technology and other nonmedia costs. |
| Economic impact | Direct, indirect and induced effects of visitor spending within a defined place and period | Describing visitor-economy value | A large economic-impact number does not prove that a specific campaign caused the impact. |
| Efficiency metric | Cost per qualified visit, partner action, RFP, room night or incremental visitor | Optimizing a specific pathway | The action must have a stable definition and decision threshold. |
Build your DMO ROI Measurement Scorecard
Give every KPI a definition, source, owner, cadence, baseline, target, confidence label, decision threshold and last-update date. That structure turns DMO marketing ROI into a management tool instead of a quarterly collection of charts.
Use the Demand-to-Impact FrameworkA DMO measurement system should mature from media delivery to visitor and partner value
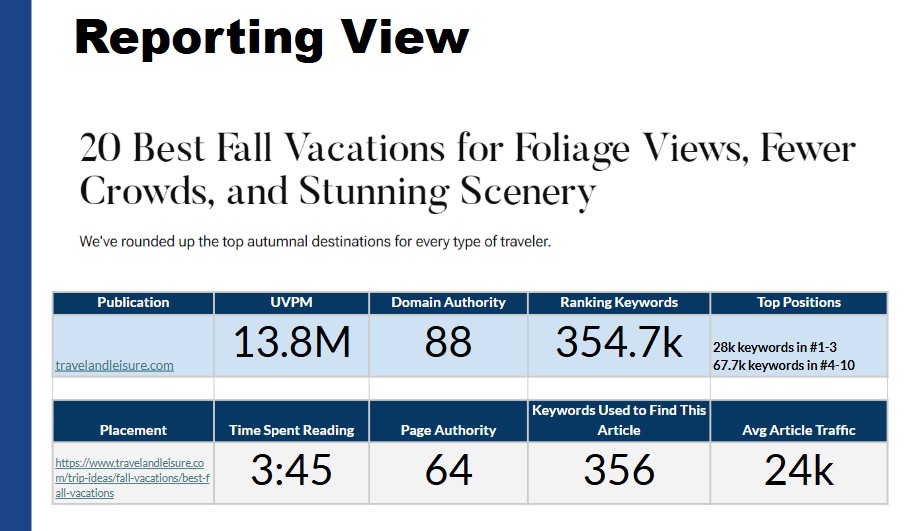
Explore Hunterdon offers a useful measurement-maturity example. Reporting for a 108-day campaign documented 7 million impressions, approximately 73,000 site visitors, 13,106 direct banner clicks, a click-through rate reported as 20% above average and nearly 2.85 million in Facebook reach.
Those figures establish delivery and measurable response. The harder questions come next: Which feeder markets produced visitors? Which local categories received spending? Can marketing exposure be connected to actual trips? Can the evidence support commissioner and funding discussions?
The lesson for DMO marketing ROI is not to discard reach or traffic. It is to keep moving toward stronger behavioral evidence, clearer partner outcomes and a documented public-value statement.
The DMO marketing ROI framework: Demand-to-Impact Evidence System
Percepture’s DMO Demand-to-Impact Evidence System is an eight-level DMO marketing ROI methodology for connecting destination marketing investment to public value without hiding source, attribution or uncertainty.
Media, agency, creative, research, staff, technology, co-op and measurement
Required output: Fully Loaded Cost
Reach, frequency, placements, assets and search or AI visibility
Required output: Exposure Record
Engaged visits, itinerary use, guides, opt-ins and high-intent planning behavior
Required output: Qualified Demand Index
Referrals, booking handoffs, tickets, RFPs, calls and map actions
Required output: Conversion Record
Arrivals, room nights, attendance, origin, stay length and category spending
Required output: Observed Destination Outcome
Direct spend, tax, partner distribution and stewardship measures
Required output: Public Value Statement
Holdouts, matched markets, exposed-control studies or econometric estimates
Required output: Incremental Lift Estimate
Scale, optimize, reallocate or stop
Required output: Budget Decision Log
Do not call delivery metrics ROI. A defensible DMO marketing ROI calculation includes the full cost denominator, discloses the economic model and assumptions, and does not move from correlation to causality without a credible counterfactual.
Choose KPIs by objective
For DMO marketing ROI, choose KPIs after the objective, not after the channel. A paid-search click may be useful for optimization, but it cannot replace visitation or partner-value evidence when the stated objective is destination demand.
| Objective | Primary KPIs | Decision supported |
|---|---|---|
| Awareness and perception | Aided awareness, consideration, message association, search lift, quality earned reach and sentiment | Scale or revise audience and message strategy |
| Website and trip planning | Engaged sessions, itinerary use, guide views, opt-ins, partner referrals and booking handoffs | Optimize content and conversion paths |
| Leisure visitation | Arrivals, room nights, target-period demand, origin, stay length, spending and incremental lift | Reallocate markets, periods and media |
| Meetings and conventions | Qualified RFPs, site visits, definite business, room nights, attendance and lost-business reasons | Improve pipeline quality and sales support |
| Sports and groups | Bids, events won, room blocks, registrations, attendance and repeat potential | Assess event and group value |
| Partner and community value | Referrals by category and geography, partner-reported value, tax, sentiment, dispersion and capacity | Balance growth with local benefit |
| PR, SEO, content and AI | Quality placements, links, nonbrand visibility, partner actions, assisted conversions and answer visibility | Evaluate durable earned and owned demand |
An integrated program may combine public relations, content marketing, enterprise SEO and generative engine optimization services. In DMO marketing ROI reporting, each channel still needs its own role in the evidence chain.
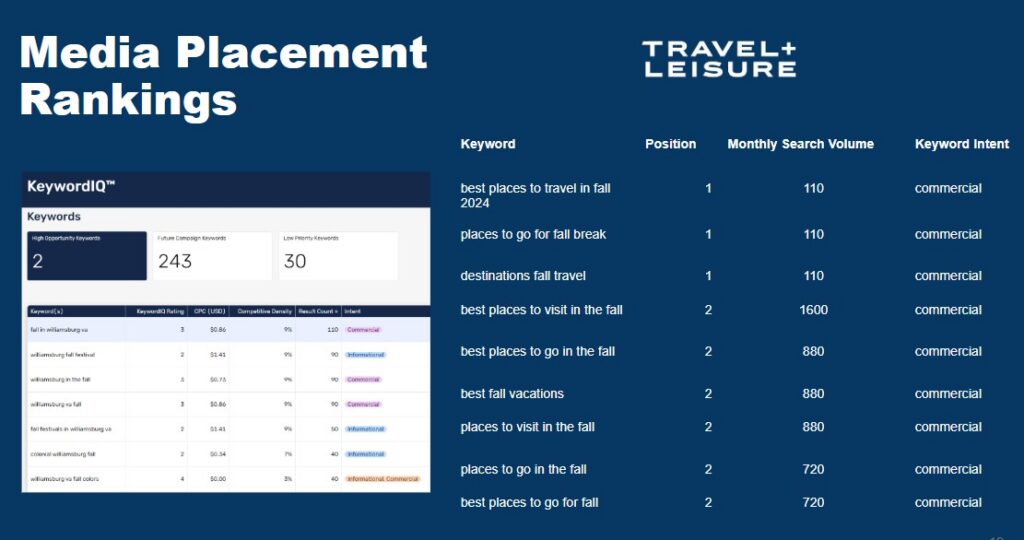
Build attribution around the travel cycle
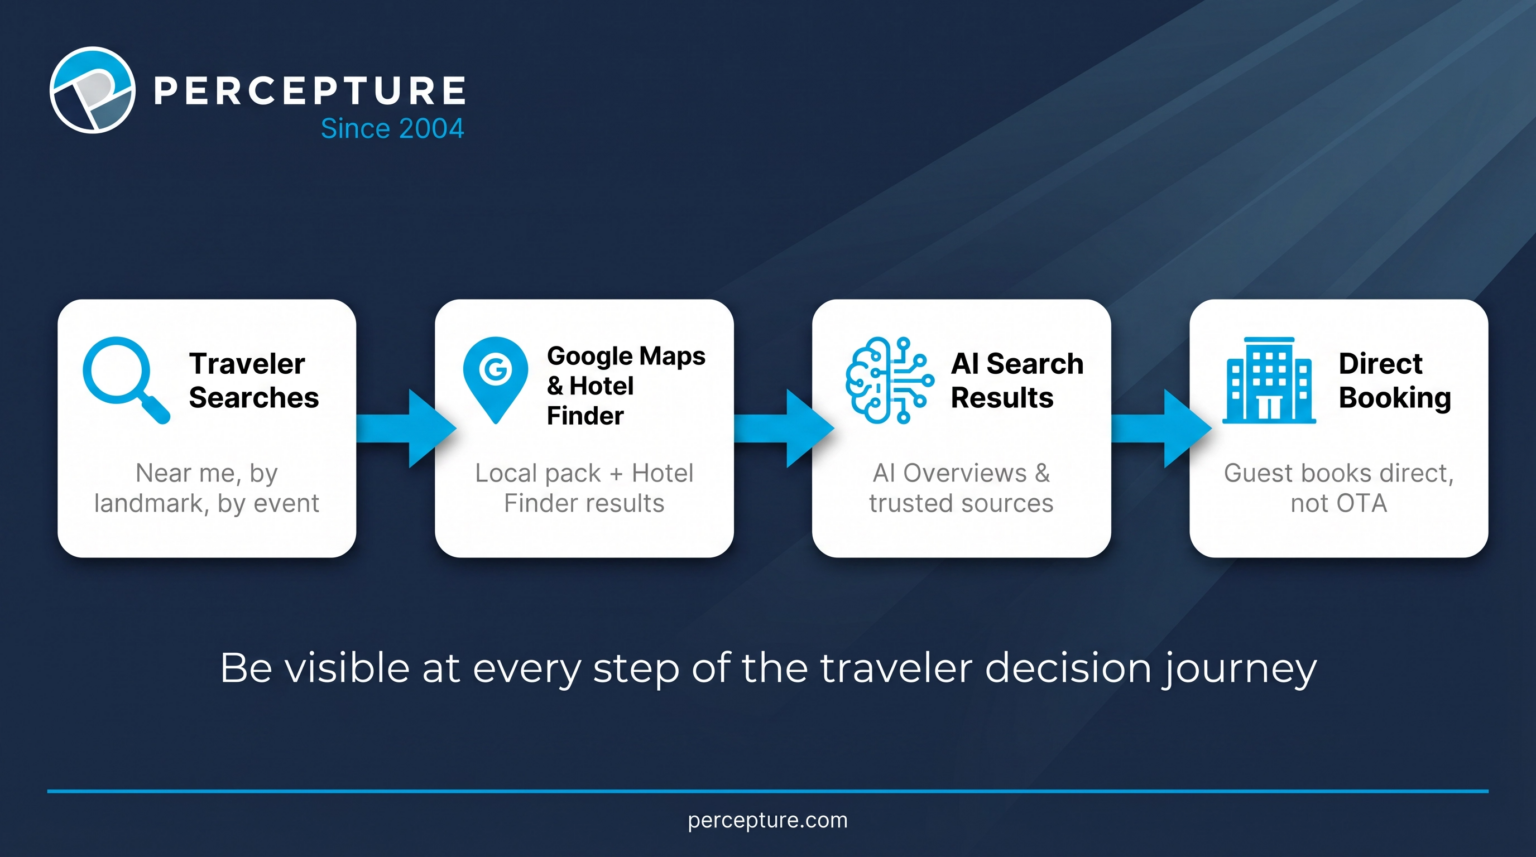
A destination purchase rarely happens in one session. Exposure, research, comparison, booking and travel can occur across different devices, platforms and partners. DMO marketing ROI should therefore report campaign dates, planning dates, booking dates, travel dates and the reporting close date.
| Method | Best evidence | Main limitation |
|---|---|---|
| Direct transaction | Observable action and revenue | Misses offline and assisting channels |
| Partner referral | Movement from DMO content to a partner | The final sale may remain hidden |
| Web or platform attribution | Digital behavior and campaign response | Overlap, consent limits and walled gardens |
| Visitor survey | Influence, origin and reported behavior | Recall and sample bias |
| Location or transaction study | Visitation or category-spending signals | Panel, matching, privacy and coverage assumptions |
| Matched market or holdout | Incremental lift | Requires suitable scale and comparison design |
| Economic-impact model | Visitor-economy value | Does not establish campaign causality |
Use attribution and analytics to define the method before the campaign begins. Use customer journey mapping to identify where the destination site hands demand to partners.
Measure incrementality
The strongest question is not simply what happened after marketing ran. It is how many visits, bookings, room nights or dollars would not have occurred without the marketing.
For DMO marketing ROI, start with a baseline and a credible comparison. Log weather, events, capacity changes, pricing shifts and other outside factors. Set a window that covers exposure, planning, booking and travel. Then compare exposed and unexposed outcomes, state confidence and translate the result into a cost, value and allocation decision.
The closer a metric gets to visitor behavior and incremental change, the stronger the evidence. That does not make early indicators useless; it places them at the correct level of the DMO marketing ROI evidence chain.
Connect visitation to spending
Visitor-spending evidence may come from transaction panels, lodging and tax records, tickets, registrations, partner bookings, surveys, event systems, mobile panels or booking analytics. No source covers everything, so the report must disclose scope and limits.
| Disclosure field | What the report should state |
|---|---|
| Scope | Geography, campaign dates, travel dates and visitor definition |
| Spend | Included categories and data source |
| Coverage | Sample, panel, matching method and exclusions |
| Attribution | Control, baseline, platform model or no causal attribution |
| Economics | Model, multiplier source and model year |
| Confidence | Observed, estimated, modeled, directional or incremental |
| Limits | Lag, privacy constraints, overlap and missing categories |
Never multiply all website traffic by average visitor spend. Gross spending is not automatically incremental, and tax, visitor spending and economic output are not additive. A DMO marketing ROI report should also distinguish jobs supported from jobs created and avoid comparing studies that use different visitor definitions.
Measure partner value
A DMO measures value across an ecosystem it does not fully own. When the DMO does not own the booking, the partner handoff becomes a core measurable conversion point.
For DMO marketing ROI, track outbound referrals, partner category and geography, booking-engine handoffs, map actions, calls, passes, coupons, RFPs and partner-reported sales. A consistent link taxonomy makes these pathways easier to compare across hotels, venues, attractions, restaurants and events.

For a broader view of travel search pathways, compare destination measurement with hotel SEO and technical SEO for hotels. These disciplines show why visibility, site experience and booking readiness must be measured as connected steps.
Use trackable revenue without overstating total return
Visit Elizabeth City provides an example of a more observable paid-search path. Supplied campaign reporting documented 329,000 impressions, 4,210 clicks, a 5.23% conversion rate, 220 purchases and approximately $14,800 in sales, excluding Facebook.
Those figures can support direct conversion reporting and attributed revenue analysis. They do not establish DMO marketing ROI without total media, agency, creative, staff, technology and measurement costs. They also do not represent all destination spending.
This is where paid media, paid search and conversion rate optimization should share one measurement plan. The campaign team can optimize observable actions while leadership preserves the distinction between channel ROAS and DMO marketing ROI.
Build a board-ready dashboard
A DMO marketing ROI board dashboard should be brief enough to review and complete enough to challenge. It should show the investment, demand, partner action, destination outcome, public value, confidence and next decision on one page.
| Panel | Contents | Board question |
|---|---|---|
| Investment | Total cost, media and nonmedia cost, co-op or in-kind value and variance | What did we invest? |
| Demand | Awareness, search, qualified planning and feeder-market response | What behavior changed? |
| Partner Action | Referrals, booking handoffs, RFPs, site visits and category distribution | Where did useful demand go? |
| Destination Outcome | Visitation, room nights, attendance, spending and need-period change | What happened in the destination? |
| Public Value | Tax, economic-impact estimates, partner distribution and stewardship | Who benefited, and how? |
| Confidence and Decision | Evidence label, limitation, window and scale, optimize, reallocate or stop decision | How certain are we, and what happens next? |
Board reports should state what is observed, attributed, modeled and uncertain. In DMO marketing ROI reporting, a consistent data visualization system makes those distinctions visible without burying decision-makers in channel reports.
Protect data quality and privacy
Governance is part of DMO marketing ROI because weak definitions can make a polished dashboard unreliable. Maintain a data dictionary, source owner, retention policy, correction process, geographic definition, visitor definition, privacy review and reproducible calculation for every reported result.
Questions to ask data and research vendors
- What is observed, attributed, estimated or modeled?
- Who is represented in the data, and who is excluded?
- How are visitors, residents, exposures and repeat trips defined?
- Is there a control group, baseline or other counterfactual?
- Which spending categories are visible?
- What are the sample, coverage and match limitations?
- How are duplicate platforms, devices and conversions handled?
- What privacy safeguards, suppression thresholds and export rights apply?
- Can a third party reproduce the calculation?
- What should the DMO never claim from the dataset?
A DMO marketing ROI example should not enter an article, proposal or board deck unless its source, definition and permitted use can be documented.
Launch a 90-day pilot
Days 1–30: Define
Inventory objectives and costs. Reconcile finance and marketing definitions, map data sources, set baselines and windows, choose confidence labels and name one priority budget decision.
Days 31–60: Instrument
Standardize campaign IDs and UTMs, configure conversions, build a partner-link taxonomy, connect CRM or RFP systems, create the data dictionary and test exports.
Days 61–90: Pilot
Run one bounded test, such as a paid-search revenue path, partner-referral improvement, need-period study, event-to-room-night analysis or meetings pipeline test.
Report the result, source, confidence, limits, cost, decision and next test. A 90-day pilot can improve DMO marketing ROI measurement, but it should not promise a complete incrementality and economic-impact system when data access is immature.
Avoid common ROI errors
Calling activity ROI
Calling impressions, reach, clicks or media-value equivalency DMO marketing ROI misstates activity as financial return.
Using incomplete costs
Media-only denominators can overstate return by excluding creative, staff, agency, research and technology.
Presenting correlation as causation
A campaign followed by strong visitation does not prove the campaign caused the increase.
Closing the window too soon
Short windows can miss travelers who research, compare and book over a longer period.
Ignoring partner outcomes
Measuring only the destination website hides the handoffs where much of the ecosystem value occurs.
Reporting without a threshold
If no result triggers a decision, the dashboard records activity but does not guide allocation.
Why Percepture has a point of view
Percepture approaches DMO marketing ROI as an operating system rather than a single formula. The work connects strategy, media delivery, search visibility, partner pathways, conversion measurement, destination outcomes and board communication.
That approach is supported by Percepture’s travel and tourism marketing practice and omnichannel marketing capabilities. It also reflects the practical gap between what a platform can attribute and what a public destination organization can responsibly claim.
Match the measurement scope to the decision
A campaign dashboard, partner-path analysis, incrementality study and full destination measurement system are different engagements. The right scope depends on data access, partner participation, decision urgency and the confidence level the board requires.
Frequently asked questions
What is DMO marketing ROI?
DMO marketing ROI compares incremental value attributable to destination marketing with the full cost of producing that value. The numerator may use an approved measure such as contribution, partner revenue or tax value. The denominator should include media and relevant nonmedia costs. The result is only as credible as the attribution method and value definition behind it.
How is destination marketing ROI calculated?
A DMO marketing ROI calculation subtracts total marketing cost from incremental value attributable to marketing, divides the result by total marketing cost and multiplies by 100. Define value before calculating. If the destination cannot establish incrementality, report observed outcomes, attributed results and economic-impact estimates separately instead of presenting a causal ROI figure.
What is the difference between ROI and ROAS?
DMO marketing ROI evaluates value against the full cost of the marketing effort. ROAS divides attributed revenue by media spend. ROAS is useful for campaigns with observable transactions, but it is narrower because it usually excludes creative, agency, staff, research, technology and measurement expenses.
Is tourism economic impact the same as marketing ROI?
No. Economic impact describes direct, indirect and induced visitor-economy value within a defined geography and period. Marketing ROI asks how much incremental value can credibly be attributed to marketing after accounting for cost. An economic-impact estimate does not by itself prove that a campaign caused the reported activity.
Which KPIs should a DMO track?
For DMO marketing ROI, track KPIs that match the objective: awareness and search lift for perception, qualified planning actions for website performance, referrals and booking handoffs for partner value, visitation and room nights for destination outcomes, and spending or tax measures for public value. Every KPI also needs a source, owner, baseline, target and decision threshold.
How can a DMO measure bookings it does not own?
For DMO marketing ROI, measure the handoff into the partner ecosystem. Use tagged outbound links, booking-engine referrals, map actions, calls, RFPs, coupon or pass activity and partner-reported outcomes. A consistent taxonomy by partner category and geography helps the DMO show where useful demand moved even when the final transaction remains private.
How is visitor spending measured?
Visitor spending may be measured with transaction panels, lodging and tax records, tickets, registrations, partner bookings, surveys or economic-impact studies. The report should disclose geography, dates, visitor definition, category coverage, sample limits, attribution method, model assumptions and confidence. Gross visitor spending should not automatically be called incremental return.
What is incremental visitation lift?
Incremental visitation lift is the difference between actual visitation and a credible estimate of what would have happened without the marketing. It may be estimated with holdouts, exposed-control designs, matched markets or econometric methods. The study should document the comparison group, outside factors, travel window and statistical or directional confidence.
How long should a destination attribution window be?
The window should reflect the campaign, planning, booking and travel cycle rather than a standard platform default. Report exposure, planning, booking, travel and close dates. A short window can undervalue destination marketing when travelers research early, compare several partners and travel weeks or months after the first interaction.
What belongs in a DMO board dashboard?
A DMO marketing ROI dashboard should include total investment, qualified demand, partner action, destination outcomes, public value, evidence labels, limitations and the next allocation decision. Keep channel detail available for operators, but make the board view answer six questions: what was invested, what changed, what action followed, what value resulted, how certain the evidence is and what happens next.
Request a Destination Measurement and Attribution Review
Percepture can review your cost definitions, KPI architecture, partner pathways, attribution methods, dashboard logic and confidence labels. The goal is a defensible DMO marketing ROI system that helps leadership scale, optimize, reallocate or stop with better evidence.